A Gantt chart is a useful tool that provides insight into process planning and is therefore a widely used tool in project management. The graph was developed by Henry Laurence Gantt and was so effective that it was used in major projects, such as the construction of the Hoover Dam in 1931. The Fortes Change Cloud uses Gantt charts in the milestones planning and capacity planning in the Portfolio app and in project planning and resource planning in the Project app.
This article answers the following questions:
- What is a Gantt chart and what does it look like?
- From which parts does a Gantt chart consist of?
- Where are Gantt charts used in Fortes Change Cloud?
What is a Gantt chart and what does it look like?
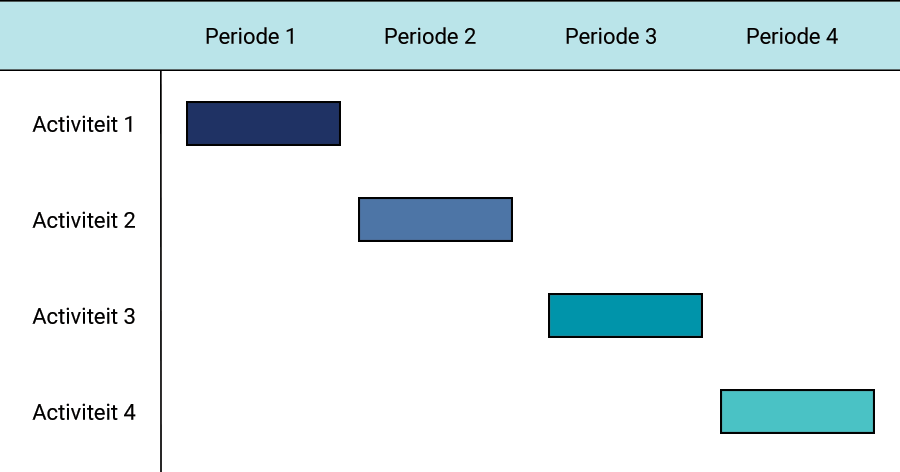
The y-axis in a Gantt chart consists of a number of rows that each display a phase or activity within a process. The first activity is often at the top and the last one at the bottom. The x-axis shows the time. A bar displays the start date and duration of the activity for each activity. In this way it is clear how much lead time an activity requires. Furthermore, mutual dependencies can be added, so it is clear that Activity B can only start when Activity A is completed.
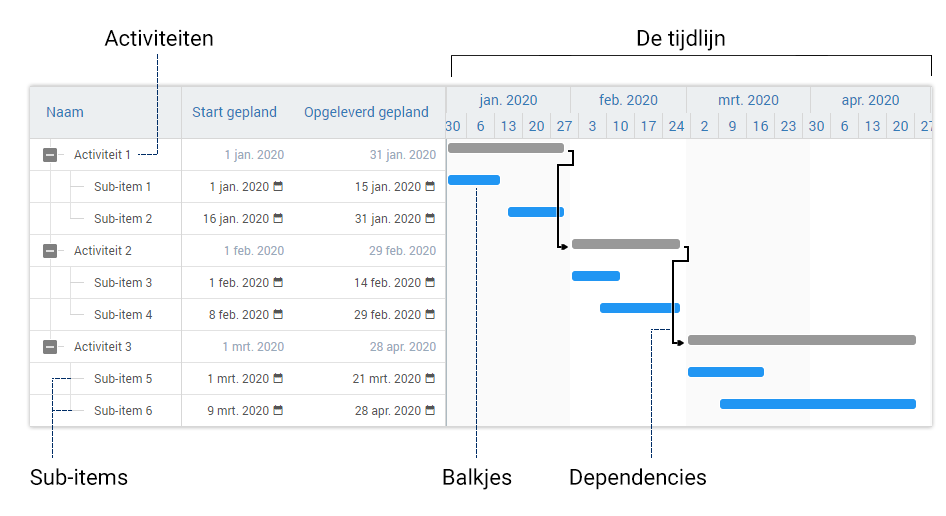
From which parts does a Gantt chart consist of?
A Gantt chart consist of a number of parts. Most components are universal for all Gannt charts. However, the Gantt charts in Fortes Change Cloud are optimized for project and portfolio management. In Fortes Change Cloud you can add columns to the graph, so that, for example, the start and end date are displayed in the overview.
- Activities or items are the portfolio items that can be scheduled. The Fortes Change Cloud automatically uses the portfolio items defined in the portfolio funnel.
- Bars are planned activities or portfolio items. The position of a bar indicates the start and end date of an activity, as well as the duration.
- Dependencies are lines between planned portfolio items. dependencies indicate that a portfolio item can’t start until a previous portfolio item is completed.
- Sub-items can be used to distribute an activity or item into different sub-items. In addition, sub-items can be used to display important milestones in the Gantt chart.
- The timeline is used to show time. The timeline can be adjusted to suit the Milestone Planning app.
Where are Gantt charts used in Fortes Change Cloud?
Gantt charts are used in different places in Fortes Change Cloud. You’ll see them mainly coming back into the Portfolio and project app, because projects and portfolios often benefit greatly from defined, clear planning. The following tabs use a Gantt chart:
- The milestone planning and capacity planning in the Portfolio app.
- The project planning and the resource planning in the Project app.


