Overview
Introduction
What is the Overview tab?
The Overview tab is the central hub within the Portfolio functionality of Fortes Change Cloud. It provides a high-level, consolidated view of the respective portfolio, containing programs, projects, and initiatives across the organization. This tab is designed to give users a quick yet comprehensive snapshot of (strategic) progress, resource allocation, and performance metrics, making it the starting point for portfolio-level decision-making.
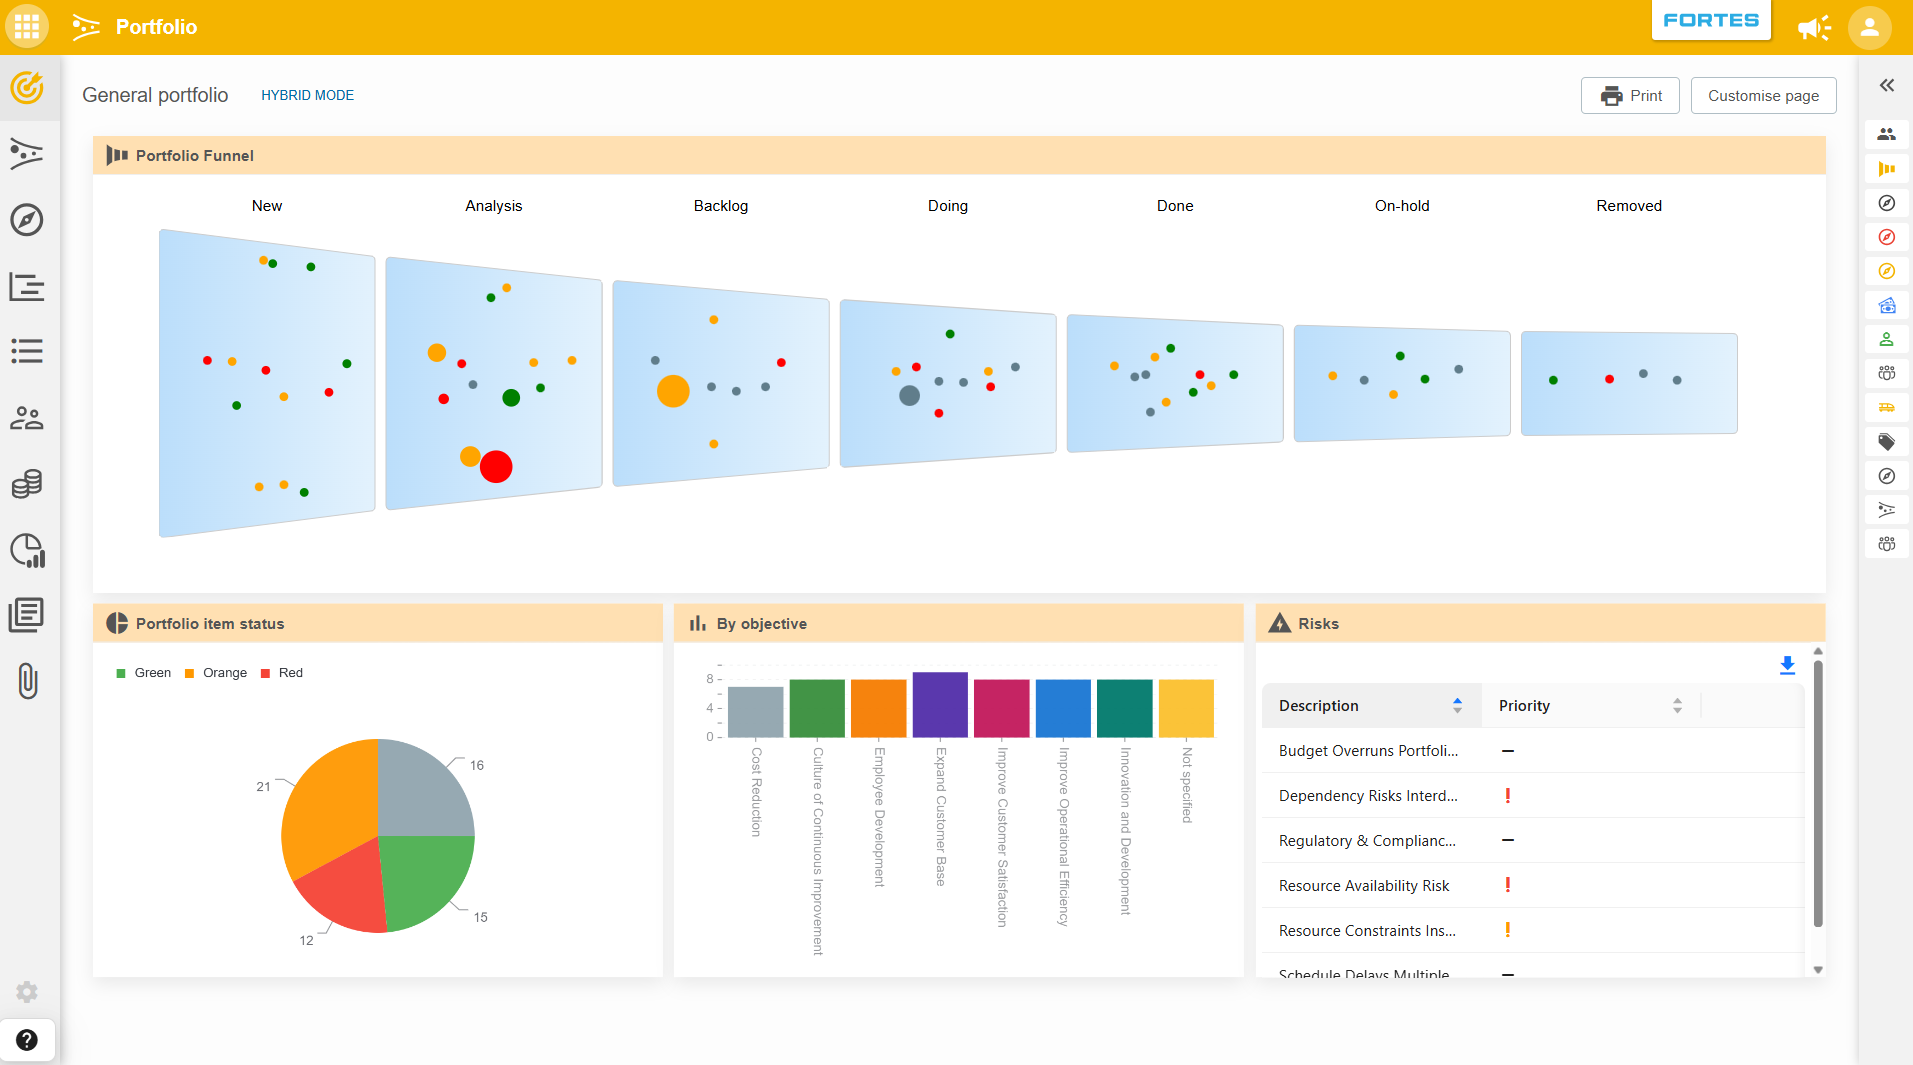
The Overview page works as a canvas: it is built from configurable segments that display different types of information. This means every portfolio can have its own tailored overview, showing exactly the data that matters most.
Who uses it?
The Overview tab is primarily used by portfolio managers, executives, strategic planners, and PMO teams. These users rely on it to monitor the health and alignment of change initiatives, assess risks, and ensure that resources are being used effectively. It’s also useful for department heads and senior stakeholders who need to stay informed about the broader strategic landscape.
What value does it deliver?
The Overview tab delivers value by:
- Providing strategic insight: Users gain visibility into how all initiatives contribute to organizational goals, enabling better prioritization and alignment.
- Supporting informed decisions: With real-time data on progress, budgets, and dependencies, decision-makers can act with confidence.
- Enhancing transparency: A shared view across teams and departments fosters collaboration and accountability.
- Identifying risks and opportunities: Early detection of issues and emerging trends helps organizations stay agile and proactive.
In essence, the Overview tab transforms complex portfolio data into actionable intelligence, empowering leaders to steer change effectively.
Available segment types
The Overview page is built from canvas segments. Each segment has its own purpose and functionality. The following types are available:
Fields
The Fields segment displays key attributes of the portfolio such as start date, end date, status, and rank. It supports both standard FCC fields and Custom Fields defined by your organization.
List
The List segment shows a tabular overview of objects such as goals, actions, risks, or issues. List segments support:
- Sorting: Choose a default sort field and direction (ascending/descending). You can configure whether the end user is allowed to modify the sorting.
- Fixed filter: Apply a fixed filter so the end user sees a pre-filtered set of items. Note that when a fixed filter is set, the Add button is no longer available in the list segment.
- Detail dialog: Enable Show link to detail dialog in the segment settings so users can click an item name to open a detail page with all fields. The detail dialog layout can be customized via the three-dot menu in the top-right corner.
Graphical segments
The following graphical segments are available to present data visually:
- Sphere diagram
- Bar chart
- Bullet diagram
- Funnel graph
- Pie chart
- Text with formatting
- Risk matrix
- Treemap
For more details on segment types and how canvases work in general, see Canvases.
How to edit the Overview page
To customize the Overview page of a portfolio, follow these steps:
1. Enter edit mode
Click Edit page in the top-right corner of the Overview tab.
Note: If the Edit page button is not available, the Overview page is managed through the Portfolio Model. In that case, the portfolio model administrator must make changes via the Model. Contact your administrator or see Portfolio Management configuration for more information.
2. Add or edit segments
- Click + Add segment to insert a new content block.
- Choose a segment type (e.g., Fields, List, or a graphical segment).
- Configure the segment by setting a title, icon, color, and optional help text.
- Drag segments to rearrange them, or resize them by dragging the bottom-right corner.
- To edit an existing segment, click the segment's settings icon.
3. Save
Click Save to apply your changes. The updated Overview page is immediately visible to everyone with a role on the portfolio.
Best practices
- Keep it focused: The Overview page should provide a quick snapshot. Avoid adding too many segments. Use the Custom Layout tab for more detailed or specialized views.
- Use help texts: Add help texts to segments to guide users on what the information means and why it matters.
- Leverage colors and icons: Use consistent colors for related segments to make the page easy to scan.
- Use graphical segments for key metrics: Charts and diagrams make trends and distributions immediately visible.
- Coordinate with the Custom Layout tab: Use the Overview for high-level data and the Custom Layout for deeper, role-specific views.
FAQ
Who can edit the Overview page?
Users with the appropriate permissions can click Edit page directly on the Overview tab. If the button is not available, the page is controlled by the Portfolio Model and can only be edited by the portfolio model administrator.
What is the difference between the Overview tab and the Custom Layout tab?
The Overview tab provides a single, shared high-level view of the portfolio. The Custom Layout tab allows for additional, more specialized pages with tailored segment configurations. Both use the same canvas segment types.
Which segment types are available?
Fields, List, graphical segments (sphere diagram, bar chart, bullet diagram, funnel graph, pie chart, text with formatting, risk matrix, treemap), Financial estimate, and Objectives estimate.
Can I sort and filter items in a list segment?
Yes. List segments support default sorting (ascending or descending) and fixed filters. You can also configure whether the end user is allowed to adjust the sorting.