List
Introduction
What is the List tab?
The List tab in the Portfolio functionality of Fortes Change Cloud provides a grid-based overview of all Portfolio items in the portfolio. It consolidates data from across the portfolio (planning, capacity, financials, and key results) into a single, configurable list. Columns can be composed on the fly, including period-based columns that sum up capacity or financial data for a specific year, quarter, or month, without the need to create custom fields.
Who uses it?
- Portfolio managers, to review Portfolio item data across the whole portfolio in one overview.
- PMO teams, to analyze capacity and financial data per period and prepare scenario comparisons.
- Executives and stakeholders with the right permissions, to consult a tabular overview of the portfolio.
What value does it deliver?
- A single overview of all Portfolio items with exactly the data that matters.
- Period-based insight into capacity and financials without configuration overhead.
- Insight into deviations through baseline comparison.
- Decision support by reviewing and applying saved scenarios.
Working with the List tab
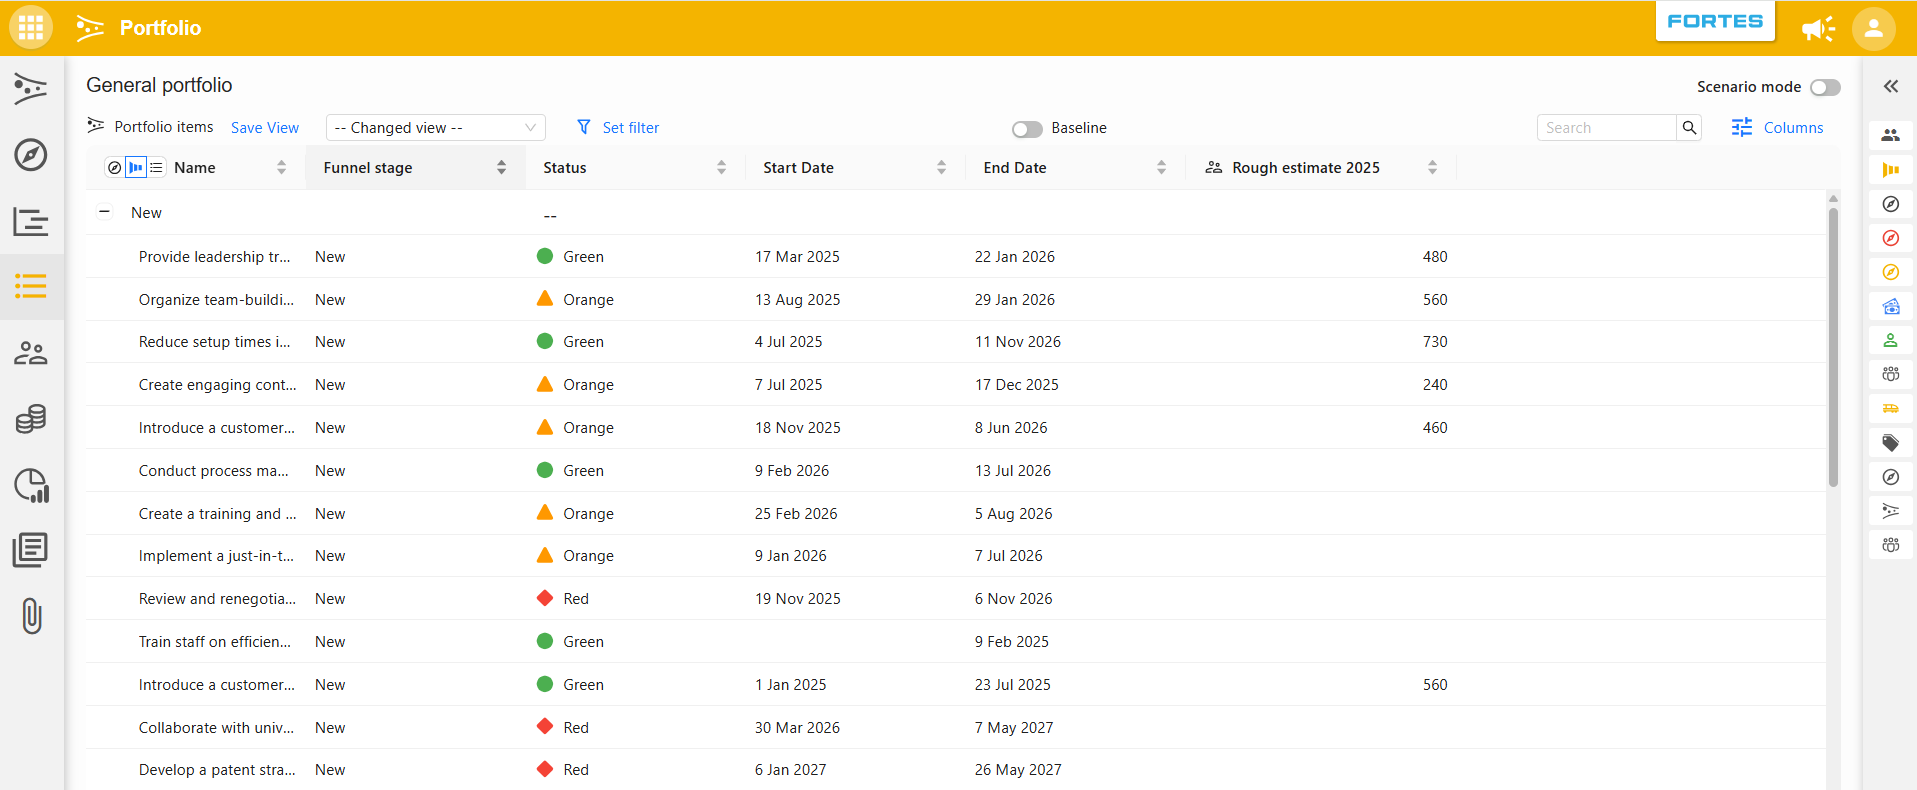
Grouping Portfolio items
Above the first column, three grouping options are available:
- Group by objective: Portfolio items are grouped under the Objectives they contribute to. Items that are not linked to an objective are grouped separately.
- Group by funnel stage: Portfolio items are grouped by the funnel stages of the portfolio (e.g. 'New', 'Analysis', 'Doing', 'Done').
- No grouping: a flat, sortable list of all Portfolio items.
Each column can be sorted using the sort arrows in the column header.
Configuring columns
Click Columns at the top right to manage which columns are shown. The Name column is pinned and always visible. Click Add columns to add existing fields as columns, searchable and grouped by type: System fields, Skill, Team, Financial category, and Key result. Confirm with Apply changes.
Creating period-based columns
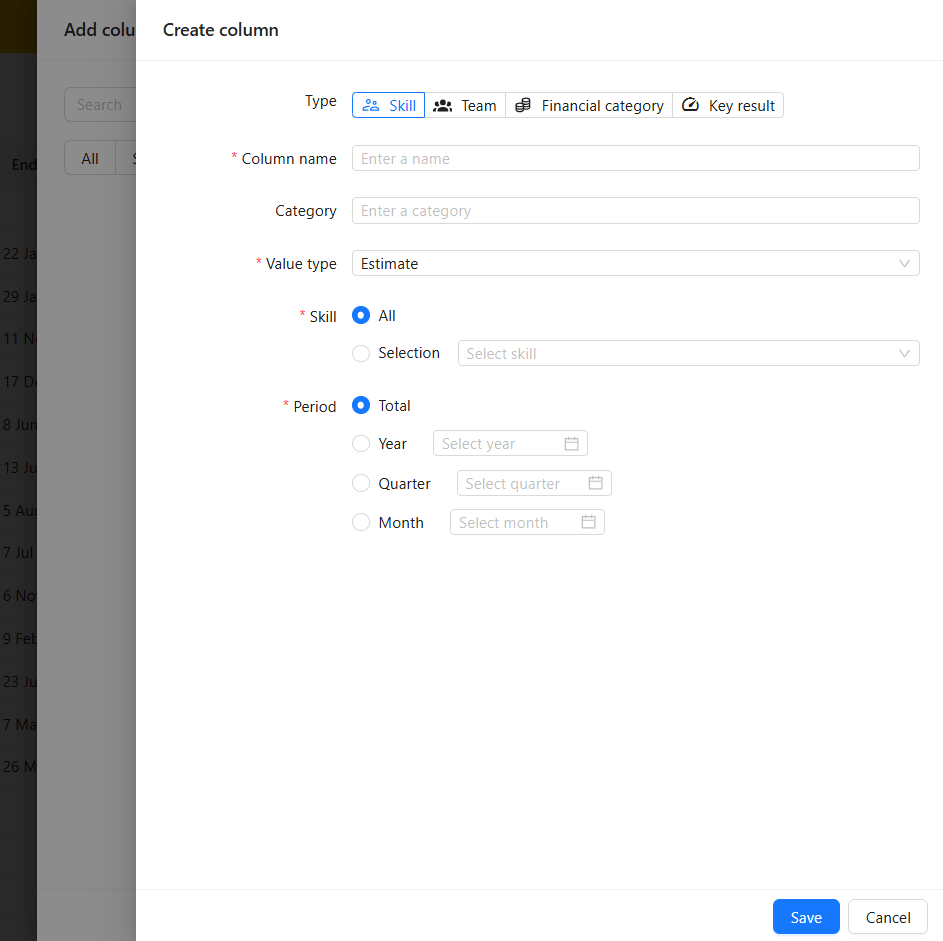
A key strength of the List tab is that columns can be created on the spot, summing up data for a specific period, with no custom fields required. In the Add columns screen, select the Skill, Team, Financial category, or Key result tab and click Add custom column. In the Create column dialog, define:
- Column name and an optional Category to group the column under.
- Value type: the data to aggregate, e.g. Allocation, Planned, Request, Actual, or Rough estimate.
- Scope: all Skills/Teams/Financial categories, or a selection.
- Period: the total, or a specific year, quarter, or month.
For example, a column 'Team allocation 2026' shows per Portfolio item the summed team allocation for the year 2026. The column is part of the list configuration and can be saved in a view, so it does not clutter the Portfolio item data model.
Filters and views
Use Set filter to limit which Portfolio items are shown, and save the resulting configuration of filters, columns, and grouping as a view with Save View. Saved views can be selected from the view dropdown, so frequently used layouts are one click away. For more information, see the Filters and views article.
Comparing against a baseline
Switch on the Baseline toggle to compare current values with a baseline. After selecting a baseline date, each value column is split into the current value and a Delta % column, making deviations from the baseline visible at a glance.
Scenario mode
Switch on Scenario mode at the top right to review a saved scenario. Select a scenario from the dropdown to see the portfolio data as proposed in that scenario. When a scenario is agreed upon, it can be applied to the portfolio with Apply this scenario.
Note: Data in the List tab cannot be edited directly. Use the Portfolio item itself, or tabs such as Balancing, to change data.
Use case: comparing scenarios across aspects
Grids such as Skill capacity planning or Financial planning are where you create a scenario, but each of them only shows a single aspect at a time: capacity in one grid, financials in another, objectives contribution in a third. The List tab is where those aspects come together: add the financial, capacity, and Key result columns you need, switch on Scenario mode, and select the scenario. This gives you one place to compare scenarios across every aspect at once, instead of checking each grid separately, before deciding which scenario to apply.
Best practices
- Use views for recurring work: Save a view per purpose (e.g. capacity review, financial check) instead of reconfiguring columns and filters each time.
- Create period columns instead of custom fields: For period-bound capacity or financial insights, a column in the List tab keeps your data model clean.
- Group by objective for strategic sessions: This immediately shows which items contribute to which objectives, and which items contribute to none.
- Keep an eye on the baseline: Regularly compare against the baseline to spot deviations early.
FAQ
Can I edit data directly in the List tab?
No, the List tab is a consolidated overview. Data is changed on the Portfolio item itself or in tabs such as Balancing.
Do I need a custom field to show capacity for a specific year?
No. Create a period-based column via Columns → Add columns → Add custom column, and select the desired value type and period.
Are my created columns visible to others?
Columns are part of your list configuration. Save the configuration as a view to reuse it or share it with others.
What happens when I apply a scenario?
The values from the scenario are applied to the portfolio and become the current data for everyone.
Need more support?
For step-by-step instructions or troubleshooting, contact your Fortes Change Cloud administrator or consult in-app help.