Grid
Introduction
What is the grid?
The grid is the shared view behind the planning tabs of Fortes Change Cloud: Financial planning, Skill capacity planning, and Team capacity planning in the portfolio, and their counterparts in the project. It sets values—money, hours, FTE—out on a timeline, per Financial category, Skill, or Team, and lets you compare different value types with each other.
Once you know the grid, you know all these tabs: they differ in what is planned, not in how the screen works.
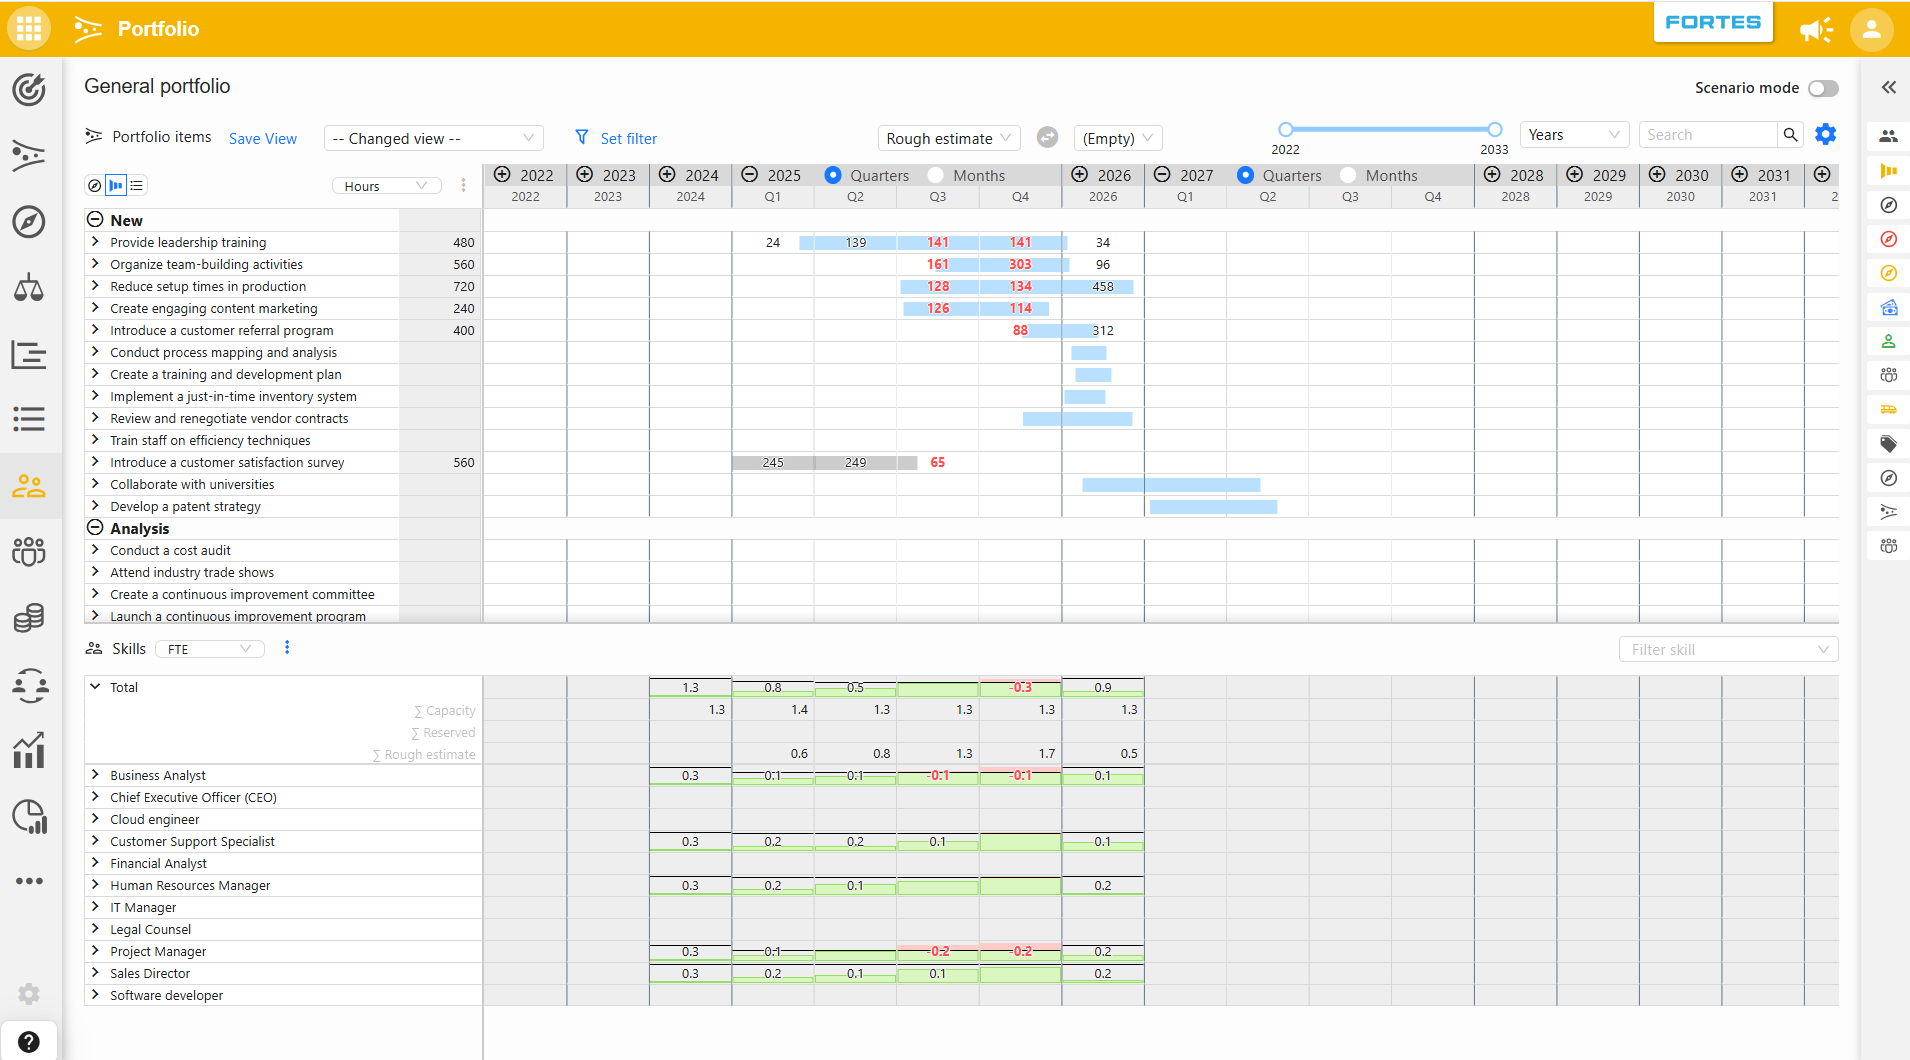
Layout
The grid consists of two sections that share the same timeline:
- Demand (top): the Portfolio items or plan items, with the values planned on them per period.
- Supply (bottom): the Financial categories, Skills, or Teams with their available budget or capacity per period. Where demand exceeds supply, the shortage is highlighted in red.
Common controls
Selecting and comparing value types
In the toolbar, select which value type is shown, for example a capacity type (Allocation, Planned, Request, Actual) or a financial classification (Budget, Forecast). Use the comparison dropdown next to it (default (Empty)) to place a second type alongside the first, e.g. 'Budget versus Forecast' or 'Allocation versus Planned'. The swap button switches the two.
Time scale and period
Choose the time scale (years, quarters, months) and limit the visible period with the period slider. Year columns can be expanded into quarters and months with the + icon in the column header, so details are only shown where you need them.
Units
Each section has a unit selector, e.g. hours, FTE, or person days for capacity, and a multiplier (×1, thousands, millions) for money. The available units come from the standard FCC conversions, which also determine how changes are spread over time.
Filters and views
Use Set filter to limit which items are shown, the row filter (e.g. Filter skill, financial category filter) to limit the supply section, and grouping (by objective, by funnel stage, or flat) to organize the rows. Save the whole configuration as a view with Save View; see Filters and views.
Configuration
The gear icon opens the grid configuration. Here administrators or managers set per tab:
- The default units of the demand and supply sections, and whether users may change them.
- The behaviour of each value type: Editable, Visible, or Hidden, separately for the portfolio and the project side.
This configuration determines what users can see and change. It is typically managed centrally in a portfolio or project model; see the financial and capacity planning articles for the recommended settings.
Scenario mode
With the Scenario mode toggle, changes can be explored without affecting the live data: review a saved scenario, compare it with the current situation, and apply it when it is agreed upon. Copying one value type to another (e.g. Planned to Request, via the ⋮ menu) also creates a scenario first, so the impact is visible before anything is final.
Where the grid is used
| Tab | What is planned | Article |
|---|---|---|
| Financial planning (portfolio/project) | Money per Financial category | Portfolio, Project |
| Skill capacity planning (portfolio/project) | Hours/FTE per Skill | Portfolio, Project |
| Team capacity planning | Capacity per Team | Portfolio |
Need more support?
For step-by-step instructions or troubleshooting, contact your Fortes Change Cloud administrator or consult in-app help.