Dashboard
Introduction
What is the Dashboard view? The Dashboard view embeds a Power BI report directly inside FCC (in portfolios, enterprise portfolios, and the Insights app). It gives you a live reporting panel without leaving the application.
Who uses it? Portfolio managers, program managers, and executives who need aggregated performance and risk reporting without switching to a separate BI tool.
What value does it deliver? A single, configurable reporting panel that refreshes on demand, supports custom fields, and can be edited in Power BI embedded mode, all from within the FCC context you are already working in.
Embedded Power BI Dashboard
Power BI is a powerful tool for analyzing and visualizing performance and risk.
With the embedded Power BI dashboards, you can easily create, view, and customize reporting dashboards for your team or management.
Power BI is available in several places within FCC:
- Insights app
- Portfolios
- Enterprise portfolios
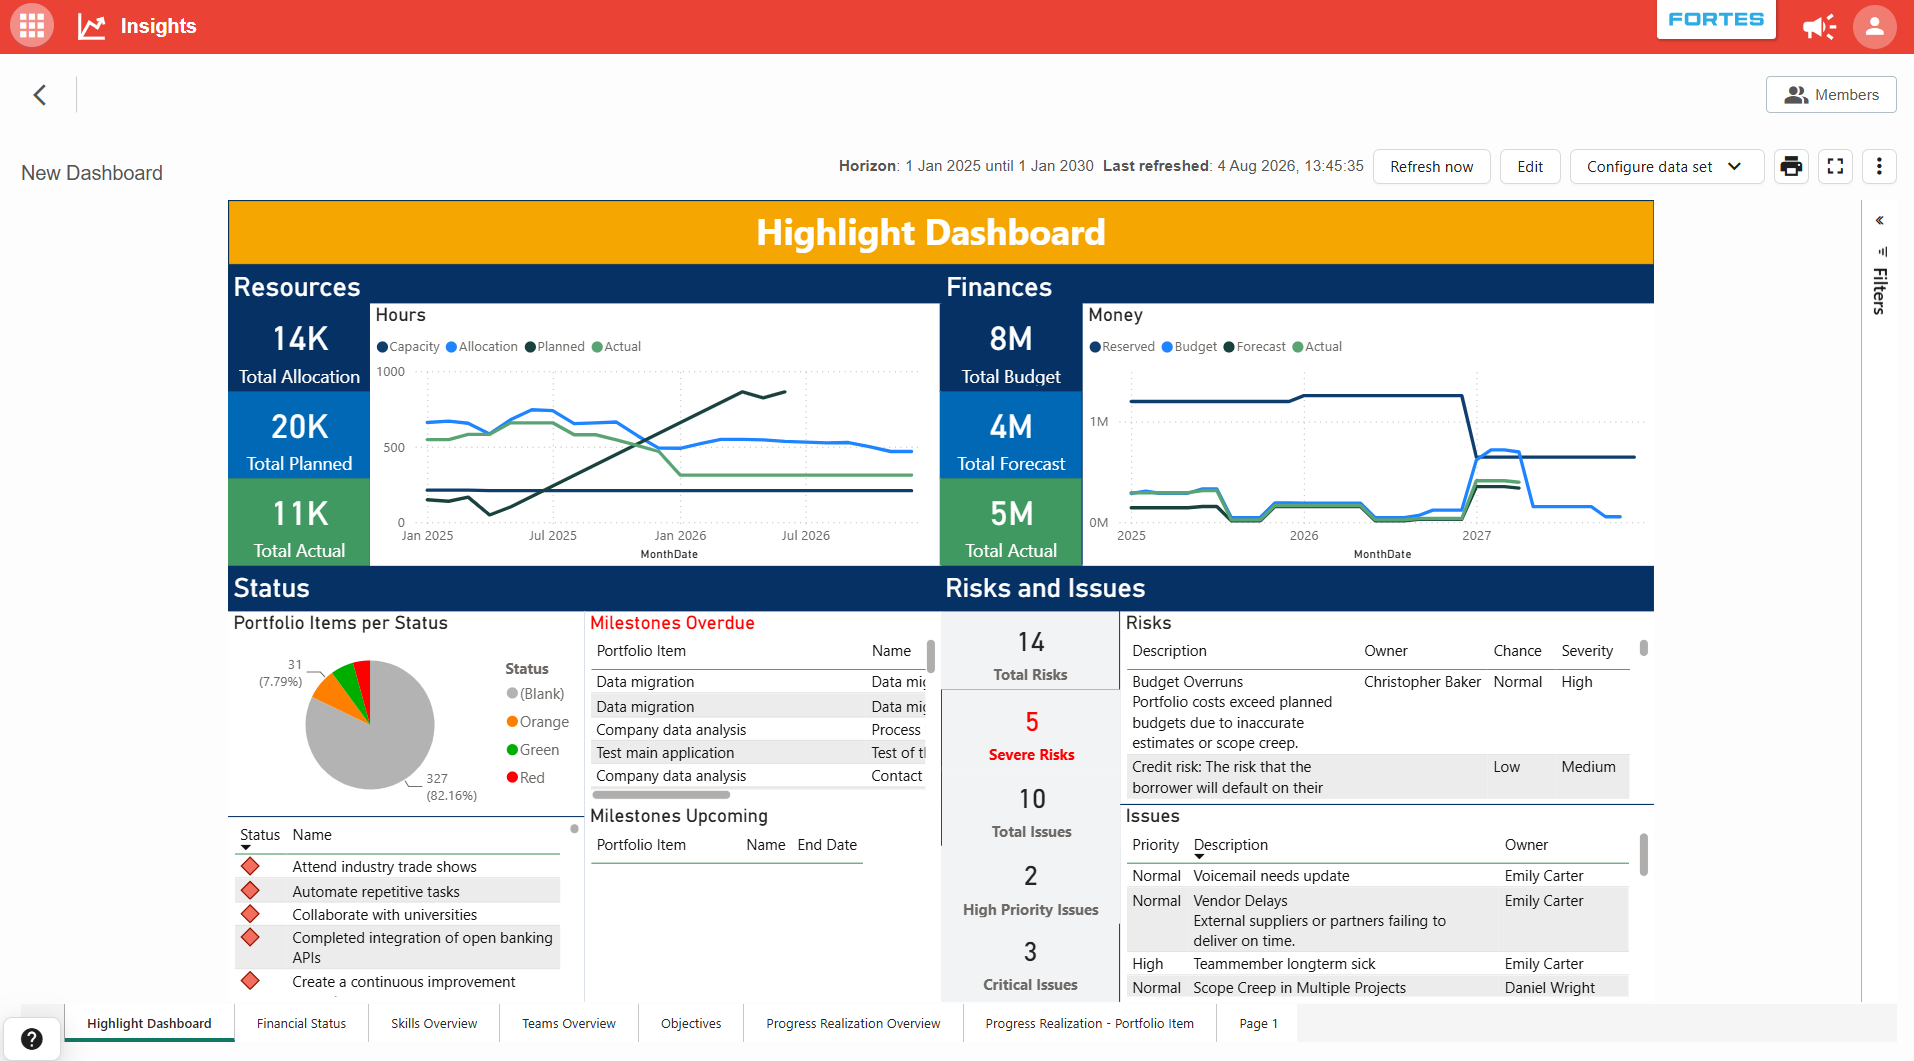
Accessing the Dashboard
A new Dashboard tab has been added in both portfolios and enterprise portfolios.
This tab loads with a standard Power BI report that includes multiple tabs (selectable at the bottom of the report).
Dashboard Features
Refresh Data
- Click Refresh Now to update the data in the report.
- The last refresh time is displayed next to the button.
- Refreshing is manual (not automatic).
Edit the Report
- Click Edit to open Power BI embedded editing mode.
- You can customize the report to fit your needs.
- In edit mode:
- Save changes to keep your edits.
- Undo changes to revert.
Set Data Fields
- Use Set Data Fields to customize which fields are included in the dataset.
- Fields can be set for each object type (e.g., Portfolio).
How it works:
- The left side shows all available fields not yet added to the report.
- The right side shows the fields currently in the report.
- Select fields on the left → click Add to report fields.
- Select fields on the right → click Remove from report fields.
- Click Set Data Fields to apply the changes.
Print the Report
- Click the Print button to print the report.
Full-Screen Mode
- Click the Full-Screen button to expand the report.
Menu Options
Under the Menu button, you’ll find:
- OData link and authentication → the Menu provides an OData link and key to connect this dashboard's data to external tools such as Power BI. This feed is scoped to the current object (for example, this portfolio only). That is the difference from the BI Connectivity app, which exposes data across the environment. For how to use the OData link and build your own reports, see BI Connectivity.
- Reset Dashboard Report to Default → restores the original report, removing any custom changes.
Best practices
Only add the fields you really need.
The more fields you add, the longer the dashboard takes to load. Keeping your dataset lean makes the dashboard faster and more responsive.
FAQ
Why can’t I find the right fields in my report?
The fields may not have been added yet. Use the Set Data Fields option to include the missing fields in the dataset. Once added, they will be available in the report.
Why is my data not up to date The data refresh is manual. Use the Refresh Now button at the top of the report to reload the latest data. The last refresh time is displayed next to the button.
Need more support?
For step-by-step instructions or troubleshooting, contact your Fortes Change Cloud administrator or consult in-app help.