Reporting
Introduction
What is Reporting in Fortes Change Cloud?
Reporting in Fortes Change Cloud provides tools to view, analyze, export, and share data. It consists of two main mechanisms: Views and Automated Reports. Views let you customize how data is displayed in lists through column selection, filtering, and sorting. Automated Reports let you generate templated reports in Excel or Word that automatically pull the latest data from Fortes Change Cloud.
Who uses it?
- Portfolio Managers and PMO Teams, to create customized views and generate regular reports for stakeholders.
- Project Managers, to analyze project data and export information for team communication.
- Executives and Stakeholders, to review automated reports on a schedule.
- System Administrators, to set up report templates and manage Automated Reports.
What value does it deliver?
- Customizes data display so you see exactly the information you need.
- Enables self-service analysis through column selection, filters, and saved Views.
- Automates recurring reports so stakeholders receive consistent, timely information without manual effort.
- Supports decision-making by making data accessible and actionable.
Working with Views
Views allow you to customize how data lists are displayed by selecting columns, applying filters, and organizing information. Once configured, you can save Views for reuse and export data to Excel.
Note: The Reporting tab is available in multiple apps (Portfolio, Project, Agile Program). The way Views work is the same across all locations.
Note: Organization Units also have a Reporting tab. A View created there reports across all underlying objects: the Portfolios, Programmes, Folders, and Projects within that Organization Unit, using the same columns, filters, and saved Views described in this article.
Setting columns
Columns determine which fields are visible in a list View. You can customize which columns appear, their order, and sorting.
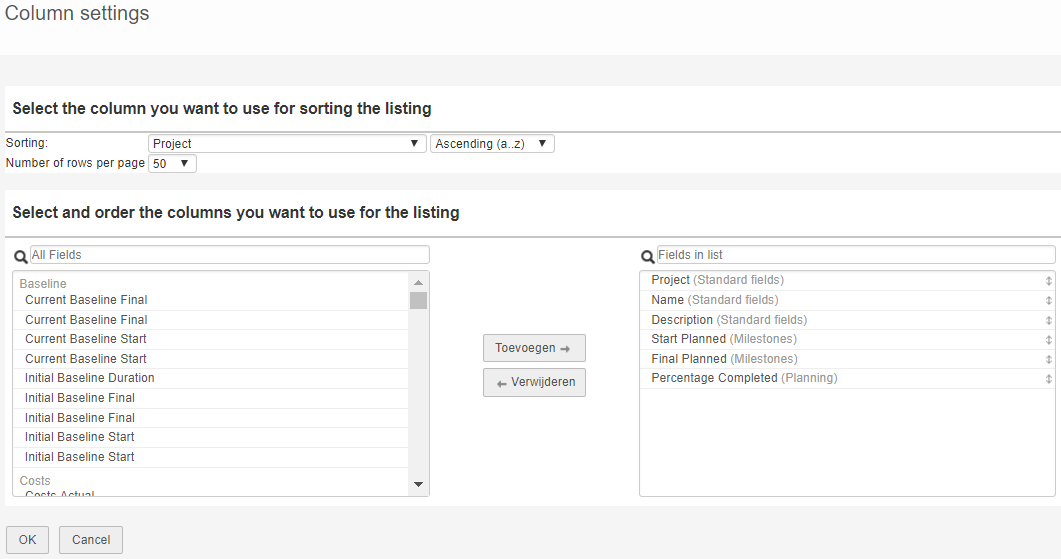
- Click the View menu, then select Set Columns. A pop-up dialog appears with two sections:
- Left side: All available fields in the system.
- Right side: Fields currently shown in your View (labeled "Fields in list").
-
Add or remove columns:
- Select a field from the left side and click Add to include it.
- Select a field from the right side and click Remove to hide it.
- Alternatively, drag and drop fields between sides or double-click a field to quickly add or remove it.
- Use the search box to find specific fields quickly.
-
Arrange column order by dragging fields in the "Fields in list" section. Columns appear in the View in the order you arrange them.
-
Configure sorting and rows at the top of the pop-up:
- Add sorting: specify which column to sort by and the sort direction (ascending or descending).
- Define rows per page: set the number of rows displayed per page.
-
Click OK to apply your column configuration.
Note: The View is named "-- Custom view --" until you save it with a permanent name.
Setting filters
Filters narrow down the data displayed in a list by specifying criteria for which rows appear.
-
Click the View menu, then select Set Filter. A pop-up dialog appears.
-
Add a filter:
- Select a field to filter on (e.g., Status, Date, Owner).
- Select a condition (Equals, Contains, Greater than, etc.).
- Enter a value (optional, depending on the condition).
- Click Add filter.
-
To filter on related objects, click the object name at the top of the pop-up and select the related object from the drop-down list. Then select a field, condition, and value from that object.
-
To remove a filter, click the garbage bin icon next to it.
Note: If a lock symbol appears in front of a filter, that filter cannot be removed (it is a system-required filter).
- Click OK to apply the filter configuration.
For more information on using filters and saving Views in the modern interface, see Filters and Views.
Saving a View for reuse
Once you have configured columns and filters, save the View so it appears in the dropdown list of available Views.
-
Click the View menu, then select Save View. A pop-up dialog appears.
-
Choose one of the following:
- Replace an existing view: select a View from the Existing View drop-down. This overwrites the previous version.
- Save as a new view: enter a name in the View name field.
-
Select the View type:
- Personal: visible only to you.
- Local: visible to everyone with a role at the current location (e.g., the project or portfolio).
- Global: visible to all users everywhere (only available for System Administrators).
-
Click OK to save.
Exporting Views to Excel
Views can be exported to Excel for further analysis or offline sharing.
- Select or create the View you want to export.
- Click the export button at the top of the View.
Exported Excel files are static snapshots of the data at the time of export. They do not automatically update if data changes in Fortes Change Cloud.
Tip: If you need recurring exports, consider setting up an Automated Report instead of manually exporting each time.
Automated Reports
Automated Reports are templated reports in Excel or Word that automatically pull the latest data from Fortes Change Cloud. They can be generated on demand or scheduled for automatic distribution.
Generating an Automated Report
- Navigate to the Automated Reports section (available on the Dashboard or Reporting tab). Icon indicators show the report type: green icon = Excel, blue icon = Word.
- Click on the report name. Depending on your browser, a dialog box appears or the report downloads automatically.
- Open the report and allow macros to run. The report automatically populates with current data.
- Save the report to disk or upload it to Fortes Change Cloud for distribution.
Note: Excel reports must be saved to disk before opening to work correctly.
Planning an Automated Report
Before building an Automated Report, consider:
- What is the purpose of the report?
- Who will use it and what decisions should it support?
- What type of report is it (portfolio, project, resource pool)? This determines which location you start from.
- What data from Fortes Change Cloud is needed and on which objects does it exist?
Creating an Automated Report in Excel
- Define the required Views. Create the Views needed for the report in the Reports section of your location.
Note: Automated Reports can only use Views created in the Reports section; Views from Dashboards cannot be used.
Tip: Prefix View names with "AR" to indicate they are used for an Automated Report. This signals that these Views should not be changed.
-
Download the empty template. Go to the Automated Reports section, click the edit button (pencil icon), and click Download Empty Template. Open the template in Excel and allow macros. Excel displays an additional PTB tab.
-
Add fields and Views. In the Excel PTB tab, click Open Keywords to view available keywords in your browser. The keywords screen has two tabs:
- Fields: individual Fortes Change Cloud fields (appear as cells).
- Views: complete Views with data (appear as tables with headers and rows).
Click a keyword and drag it into your Excel template, or right-click to copy and paste.
-
Format the report.
- Format fields directly as normal cells.
- Format table headers directly.
- Format table body only in the first empty row below the table. Click Refresh Data (in the PTB tab) to apply the formatting to the entire table.
-
Test your formatting. Click Refresh Data to verify that body formatting is applied correctly.
-
Save as template. In the PTB tab, click Save as Template and confirm.
-
Upload to Fortes Change Cloud. Go to the Automated Reports section, click the edit button, then click +. Select your file, enter a description (this is the display name), ensure Add this document as a merge template is checked, and click OK.
Working with Excel functions in Automated Reports
When adding calculations or formatting to Excel Automated Reports, follow these rules:
- Formula in a row: Place the formula in a new column in the first empty row below the table. Click Refresh Data to apply it to the entire table.
- Formula on a column: Place the formula in the row below the first empty row. The formula must include the table header to work correctly.
- Conditional formatting: Add it to the first empty row below the table, then click Refresh Data.
- Pivot tables: Always include the first empty row below the table in the pivot table range.
Rich Text fields
Fortes Change Cloud supports Custom Fields of the type Rich Text. When used in Excel Automated Reports:
Formatting maintained: bold, italic, underline, font color, font size, line breaks.
Formatting not maintained: background color, horizontal lines, bullet lists (displayed as "-" characters).
Important: Apply Wrap Text to Rich Text cells for formatting to be maintained. Without Wrap Text, all formatting is lost.
Creating an Automated Report in Word
Word reports are best for documents where data from Fortes Change Cloud is shown as-is, with limited ability to edit it.
-
Define the required Views in the Reports section, the same as for Excel reports.
-
Open a blank Word document.
-
Add fields and Views. Go to the Automated Reports section in Fortes Change Cloud, click the edit button, then click Keyword List. Drag keywords into your Word document or copy and paste them.
-
Format the document. Apply styles, headers, footers, and page numbers as needed. In tables, only character formatting (font, size, etc.) is supported.
-
Save as RTF. Save the document as an .rtf file.
-
Upload to Fortes Change Cloud. Follow the same upload steps as for Excel reports.
Best practices
- Prefix Automated Report View names with "AR" so it is clear they should not be changed.
- Create focused Views for specific use cases rather than building one universal View.
- Standardize which columns appear in similar Views across your organization.
- Test Automated Reports thoroughly before scheduling distribution.
- Use Excel export for one-time analysis; use Automated Reports for recurring needs.
- Apply Wrap Text to Rich Text cells in Excel reports to preserve formatting.
- Review saved Views and reports periodically to ensure they still meet your needs.
FAQ
Can I use Views from Dashboards in Automated Reports?
No. Automated Reports can only use Views created in the Reports section.
What is the difference between exporting a View and creating an Automated Report?
Exporting is a one-time download of data. An Automated Report is a templated document that can be generated on demand or scheduled for automatic distribution.
Can I format the body of a table in an Excel Automated Report?
Yes, but only by adding formatting to the first empty row below the table. Click Refresh Data to apply it to the entire table.
Do exported Views automatically update?
No. Exported files are static snapshots. Set up an Automated Report if you need updated data regularly.
Can multiple Views be included in a single Automated Report?
Yes. You can include multiple Views (as separate tables) in one Excel or Word template.
What file formats can Automated Reports generate?
Excel (.xlsx) and Word (.docx/RTF). PDF export may be available depending on your configuration.
Need more support?
Contact your Fortes Change Cloud administrator or consult the online knowledge base for more step-by-step configuration guides.