Visual Calculations in Embedded Power BI Dashboards
You can now add visual calculations to embedded Power BI dashboards in the Insights App and on the Dashboard tab in the Portfolio App. Visual calculations let you enrich visuals with additional computations (such as running sums, moving averages, or custom DAX expressions) without modifying the underlying data model.
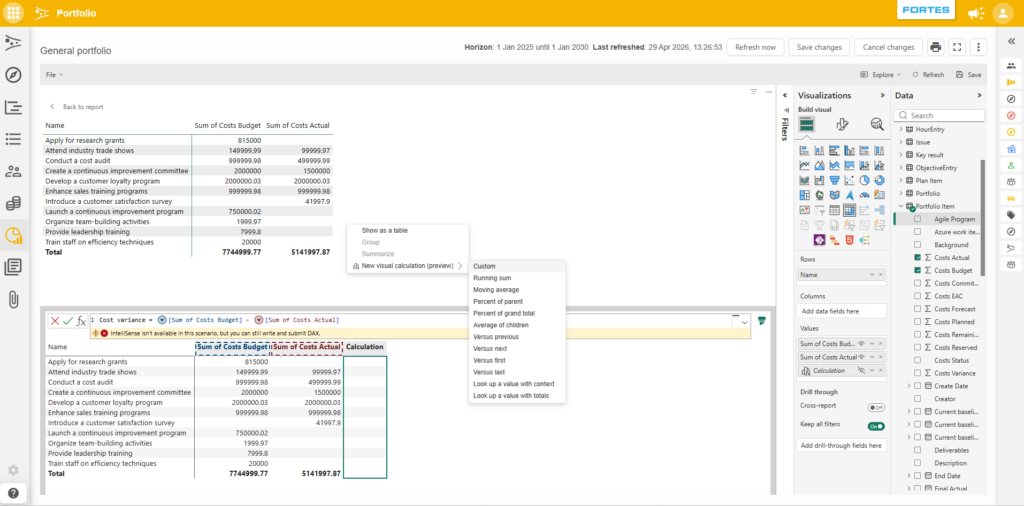
Adding a visual calculation
- Open a dashboard in edit mode in the Insights App or the Portfolio App Dashboard tab.
- Right-click on a visual (table or chart).
- Select New visual calculation.
- Choose a built-in template, or select Custom to write a DAX expression.
The calculation appears as a new column or value in the visual.
Available templates
| Template | Description |
|---|---|
| Running sum | Cumulative total across rows |
| Moving average | Average over a sliding window |
| Percent of parent | Value as a percentage of the parent group |
| Percent of grand total | Value as a percentage of the overall total |
| Versus previous / next | Row-to-row comparison |
Templates can be customized by adjusting the fields and parameters.
Custom calculations
For scenarios beyond the templates, write a DAX expression directly. Example:
Profit = [Sales Amount] - [Total Cost]
Visual calculations operate on the aggregated data already displayed in the visual, so you do not need to add aggregation functions like SUM unless your scenario specifically requires them.
For a full function reference, see the Microsoft Learn Power BI documentation.